My thesis project explored how existing sensor technology could be used to help reduce hospital readmissions for heart failure patients. We worked with the sensors developed by Proteus Digital Health, the company I did my UX internship at in 2012. Their core system has 2 sensors: an ingestible sensor which is imbedded in medication and acts solely as a marker that a pill has been taken, and a wearable sensor which receives the transmission from the ingestible sensor as well as collects biometric data.
I led the research efforts for our team. While we did extensive secondary research into best practices for reducing hospital readmissions, we knew we needed to talk with patients themselves in order to find the insights that would make this product truly useful.
It took quite a while and a few different strategies before we found the right population, but we ended up interviewing 8 people with a chronic heart condition. We’d started working on prototypes so were able to get feedback on at the same time we were gaining deeper insight into the issues they face in managing their conditions.
Here are a few of our key findings from the interviews:
FINDING: Most patients don’t understanding what heart failure actually is. Since it doesn’t have the direct feedback loop of diabetes—where people see the result of taking their medication immediately—it results in low medication adherence.
SOLUTION: We knew that integrating an educational component was critical. However our first attempts were too heavy-handed and we quickly realized we needed to make the education aspect lightweight and non-optional. We integrated one question into each daily check-in; the difficulty of the questions are based on their previous answers, so no matter what their level of understanding is, they’ll get information appropriate for them.
FINDING: The people who were more effective at managing their heart failure usually had something they cared deeply about which helped inspire them to make that effort. For most people we spoke with it was their family.
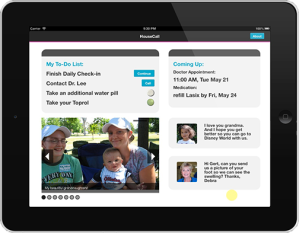
SOLUTION: We integrated a photo album on bottom half of the home screen which could be loaded with their favorite photos.

Family photos are included in the home screen to remind the patients of their motivation to get better.
FINDING: Most of the patients we talked with liked the idea of having a daily-check in to get their weight and report their symptoms; they felt like someone was watching out for them, and since they often are isolated and depressed, it was like a friend checking in on them.
SOLUTION: We made sure the language used was friendly and conversational in tone (for instance, using their name), and we repeated back their symptoms to reiterate that they were “heard”.
I did this Talking Health Research Study for a Health Information Systems class. I interviewed a number of people who’d recently attempted to change a health-related behavior. The most interesting part was the drawings I had them make of the mental models they had of their health systems, which I annotated with excerpts from their interviews. Here’s one of the drawings.
This Bike Commuter Study documents a semester-long project researching the barriers people experience in the process of becoming a regular cyclist in San Francisco. I began by interviewing people working with cycling advocacy organizations about the difficulties new cyclists had. I created and executed an online survey to better understand the attitudes of cyclists about riding in the city and attended community meetings for new bike lanes. The project culminated with interviews of 6 people who had begun cycling regularly within the previous year. I distilled my findings into an experience map which broke the process of becoming a bike commuter into 6 phases.


